


JavaScriptでグラフを描画出来るライブラリ『WebFX』
2006年08月22日-
In web applications developed now days a lot of the logic that previously resided on the server side is now being implemented on the client side. This is especially true for information presentation, components such as trees and columnlist makes it possible for users to interact with the application, or web site if you wish, without contacting the server. However the ability to present data in a graphic rather than textual format has been quite limited, unless a plugin is used or an image is requested from the server.
JavaScriptでグラフを描画出来るライブラリ『WebFX』。
サーバサイドの技術は使わず、JavaScriptのみ次のようなグラフを描画できます。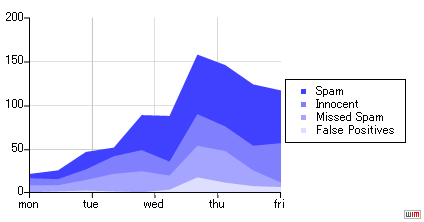
次のようにJavascriptとCSSを読み込んだ後、DIVを定義しておきます。
<script type="text/javascript" src="includes/iecanvas.js"></script>
<script type="text/javascript" src="includes/chart.js"></script>
<script type="text/javascript" src="includes/canvaschartpainter.js"></script>
<link rel="stylesheet" type="text/css" media="screen" href="includes/canvaschart.css" />
<body>
<div id="chart" class="chart" style="width: 400px; height: 200px;"></div>
そして、次のようにJavaScriptを呼び出すことでグラフを描画できるようです。
function draw() {
var c = new Chart(document.getElementById('chart'));
c.setDefaultType(CHART_AREA | CHART_STACKED);
c.setGridDensity(5, 5);
c.setVerticalRange(0, 100);
c.setHorizontalLabels(['mon', 'tue', 'wed', 'thu', 'fri']);
c.add('Spam', '#4040FF', [ 5, 10, 20, 10, 40, 52, 68, 70, 70, 60]);
c.add('Innocent', '#8080FF', [ 8, 7, 12, 20, 24, 16, 36, 28, 28, 45]);
c.add('Missed Spam', '#A5A5FF', [ 8, 7, 12, 20, 24, 16, 36, 36, 18, 5]);
c.add('False Positives', '#DEDEFF', [ 1, 2, 3, 2, 1, 4, 18, 12, 8, 7]);
c.draw();
}
window.onload = function() {
ieCanvasInit('includes/iecanvas.htc');
draw();
};
サーバ側でソフトが動かなくても使えるのが便利ですね。

By.KJ : 2006年08月22日 07:09 ![]()
![]()
 間違いの指摘をしていただける方はメール、あるいはTwitter/FBでお願いします(クリック)


最新のブログ記事(新着順)
- DarkもLightも自動生成:UI向けカラーパレット生成ツール「Harmonizer」紹介
- AIでフォーム生成できる「Formcn AI」
- ウェブサイトの CSS を解析してくれる「Online CSS Code Quality Analyzer」
- 英文を文鳥に変換するフォント「ぎゅうぎゅう文鳥」
- Tiktok公式のフリーフォント「TikTok Sans」
- React+Tailwindなサイトで使えるUIライブラリ「SmoothUI」
- 15000以上のいい感じの線形アイコン「Lineicons」
- CSSやTailwindでのCSSスニペットライブラリ「CSS Snippets Library」
- AIを使ってサイトマップが作れる「Octopus.do」
- ライブラリ依存のないモーダルオープンライブラリ「Blendy」
- 過去のエントリ
